The climate intelligence layer for cities, real estate developers, software platforms and architects

Wind, heat, sun and daylight in seconds. From buildings to cities.

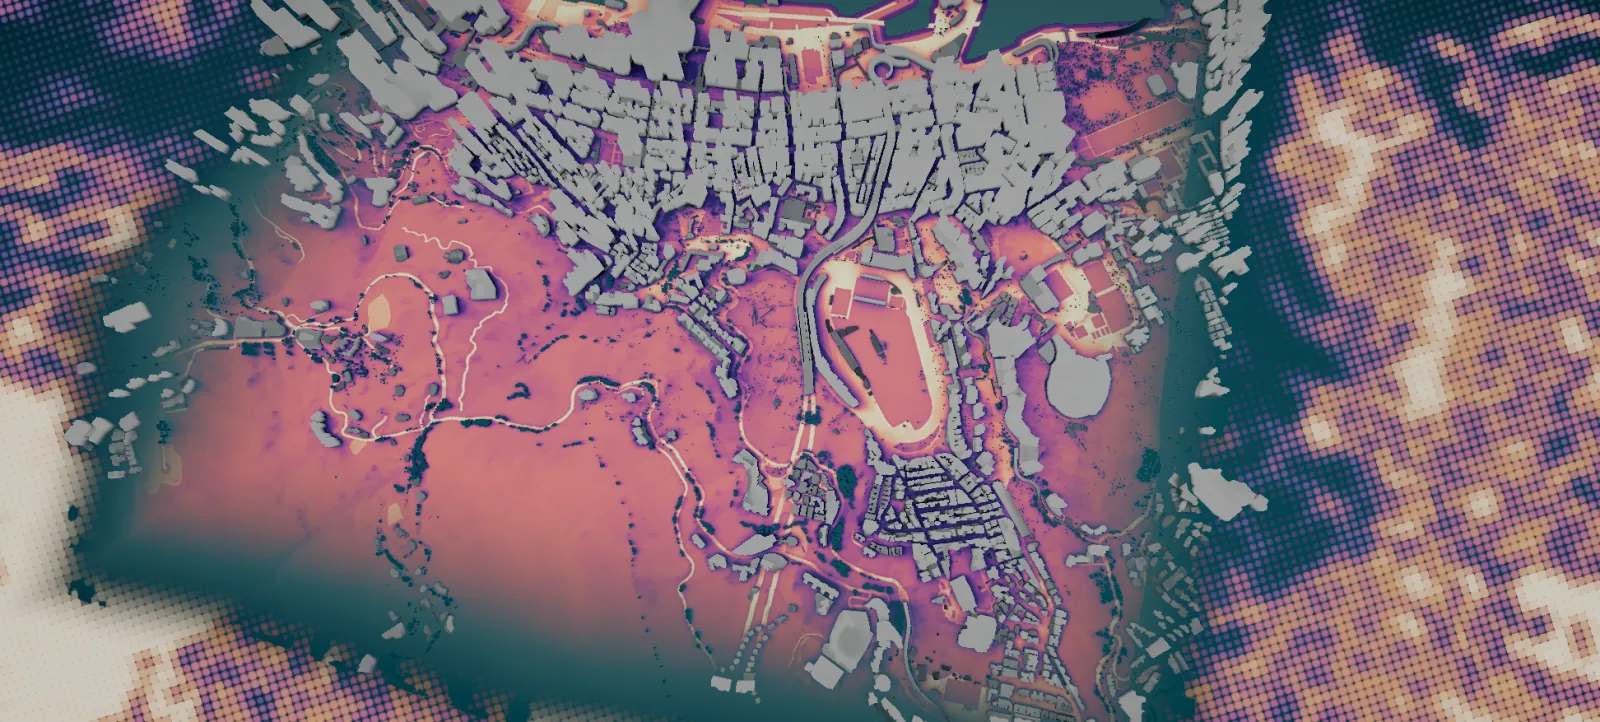
Wan Chai, Hong Kong · facade sun and street heat

How it works

Example values · buildings illustrative · streets © OpenStreetMap contributors

From a room to the whole city

Weather goes in. Your buildings, trees and streets shape the result, in seconds. Pick a tile, then point at the scene to read the value.

—
Select a simulation to explore.

Speed, measured end to end

~3 s
a 500 m site
~5 s
1 km²
37 s
100 km² of Hamburg
44 s
400 km² of Berlin

Decisions teams make with infrared.city

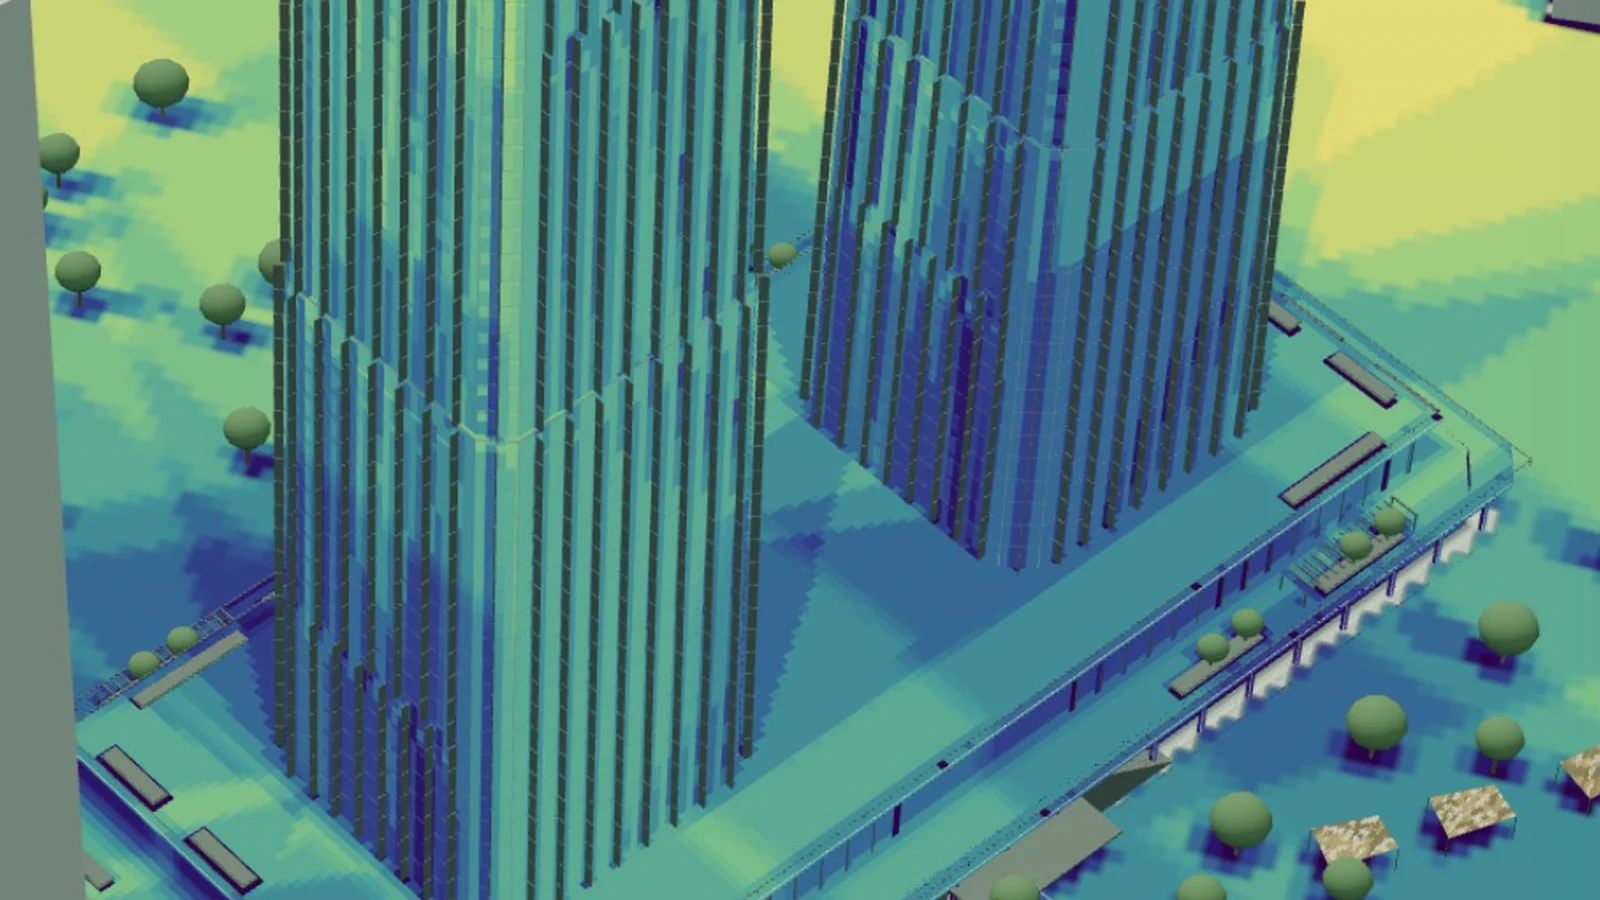
Which tower option stays comfortable, when a site crew needs shade, which street trees cool a square. Each case runs on our simulations, and you can try it in your browser.

Built by architects, engineers and scientists in Vienna

infrared.city started at the City Intelligence Lab of the Austrian Institute of Technology in Vienna. Our team turns years of simulation research into tools people use every day.

Live behind this text: the Hong Kong climate twin, sun hours on every facade, updated every hour. We prepare your city the same way.

Meet the teamThe live layer
The live layer, a public demo with Hong Kong as the example. We prepare your city the same way.

Start with a pilot on one site

Bring us a place, a workflow or a decision. We show you what the climate does there.